World Population
An interactive data visualization tracing global population dynamics from 1950 to 2100. Featuring a fluid, particle-based design, the application seamlessly transitions across a 3D globe, geographic maps, cluster views, and comparative charts to reveal the core forces shaping human history: growth, migration, aging, and decline. A unified timeline anchors the experience, allowing users to drill down into country, regional, and income-group metrics to surface critical milestones and long-term demographic transitions.
Powered by UN World Population Prospects 2024, and the World Bank data. This is a super fun collaboration with coding agents—Claude and ChatGPT. Check out the project: yuinchien.com/population.
Milestones Guided Tour Press play and let the data tell its story. Watch humanity’s biggest turning points unfold—from global fertility rates dropping below replacement levels to the historic moment seniors outnumbered youth.
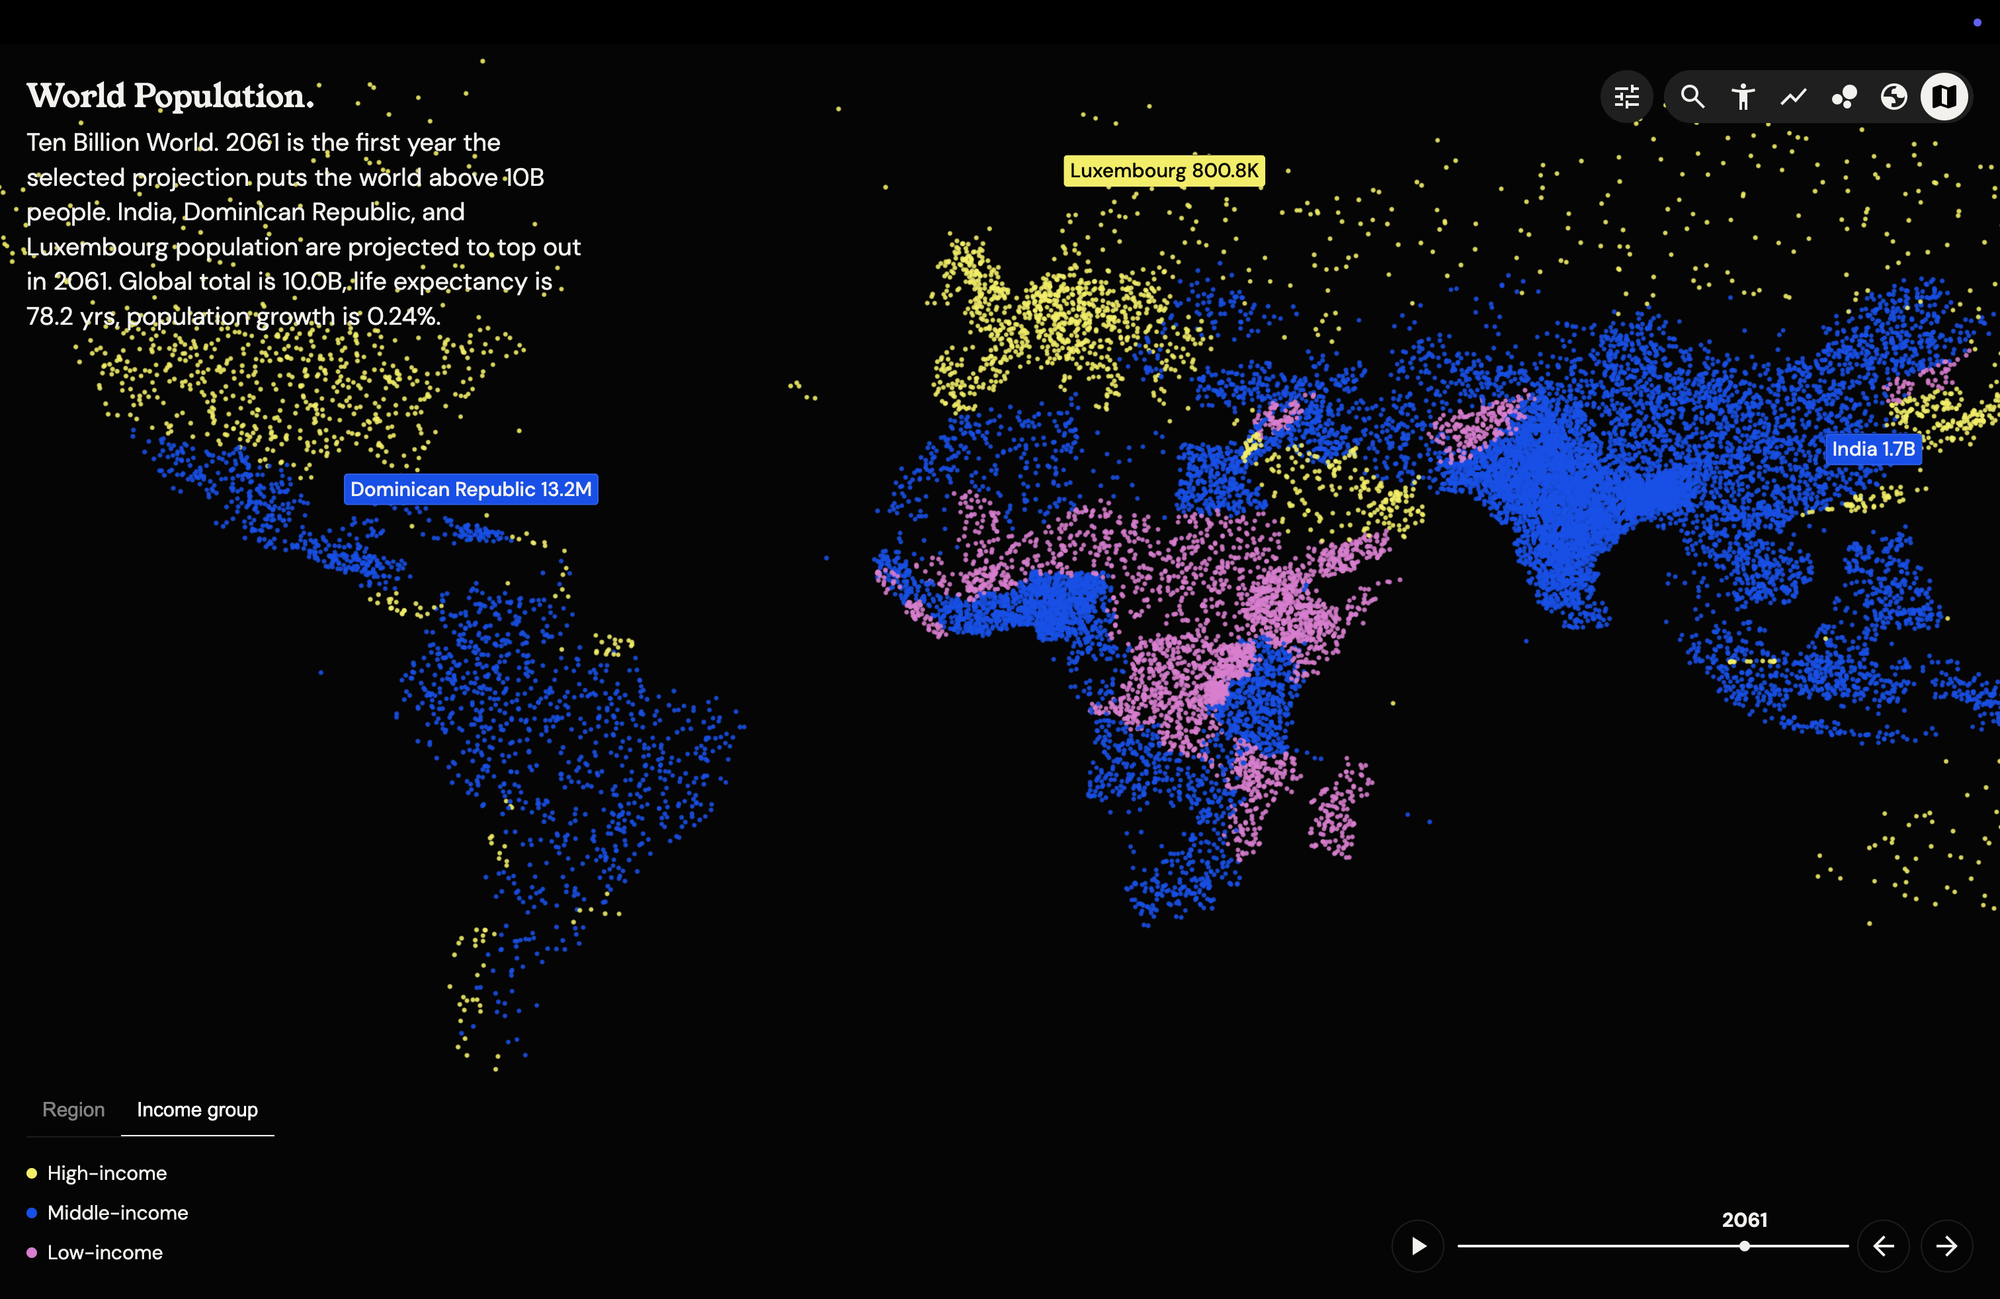
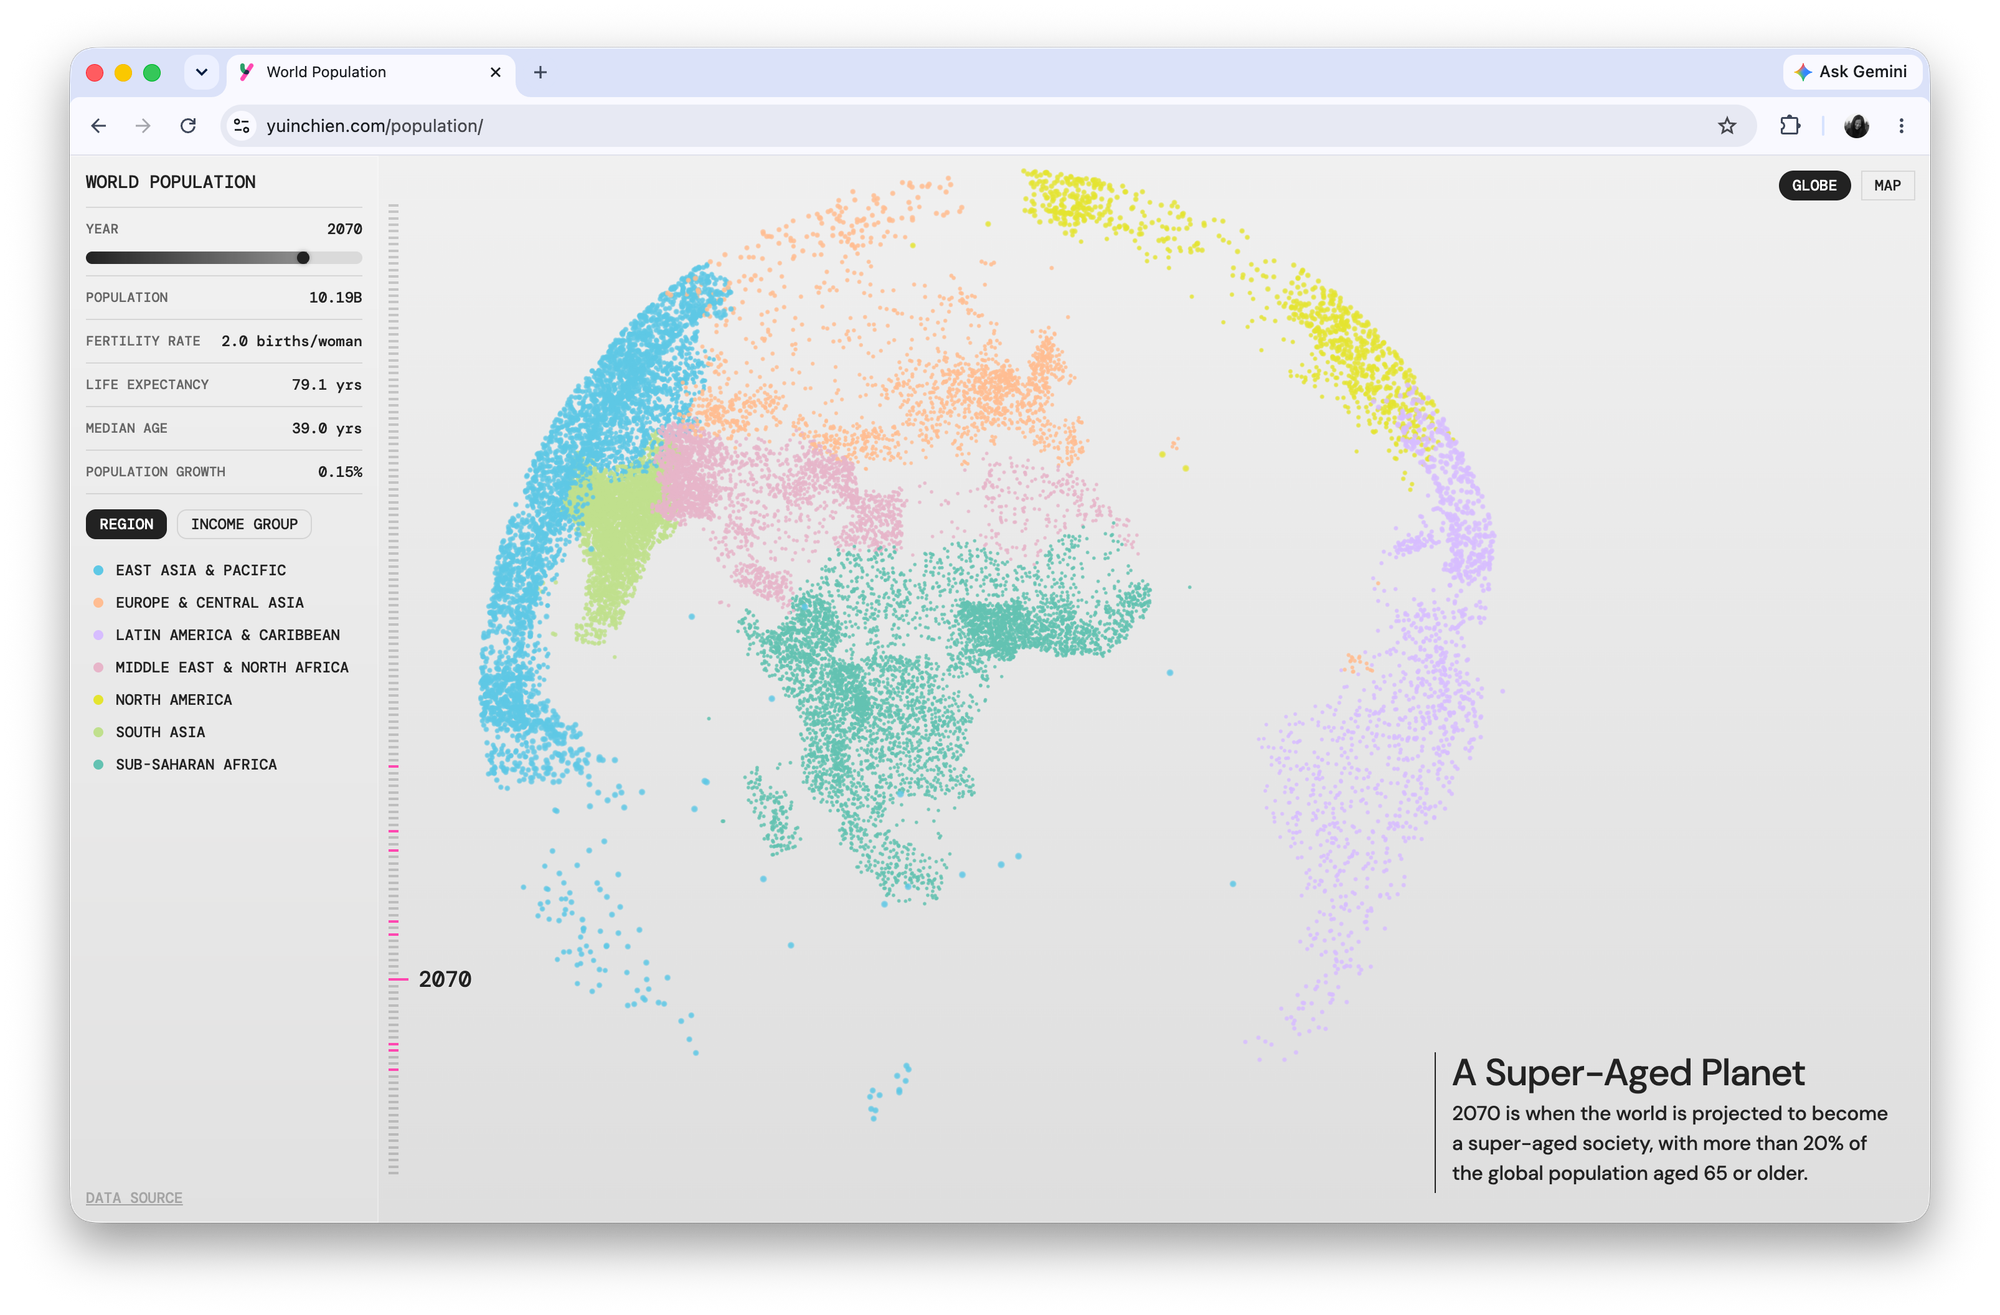
3D Particle Globe & Map view Transform abstract demographic data into a living, interactive visual system. With each particle representing 500,000 people, you can color-code the globe by region or income group. Watch the WebGL particle system smoothly transition from a 3D sphere into a flat geographic map as tens of thousands of dots fluidly reshuffle into their exact coordinate positions.
Cluster View Cluster View reveals the demographic forces reshaping countries over time. Each circle represents a country, sized by population and drawn toward a shared trajectory—from postwar expansion and emerging growth to Silver Decline and Migrant Momentum.
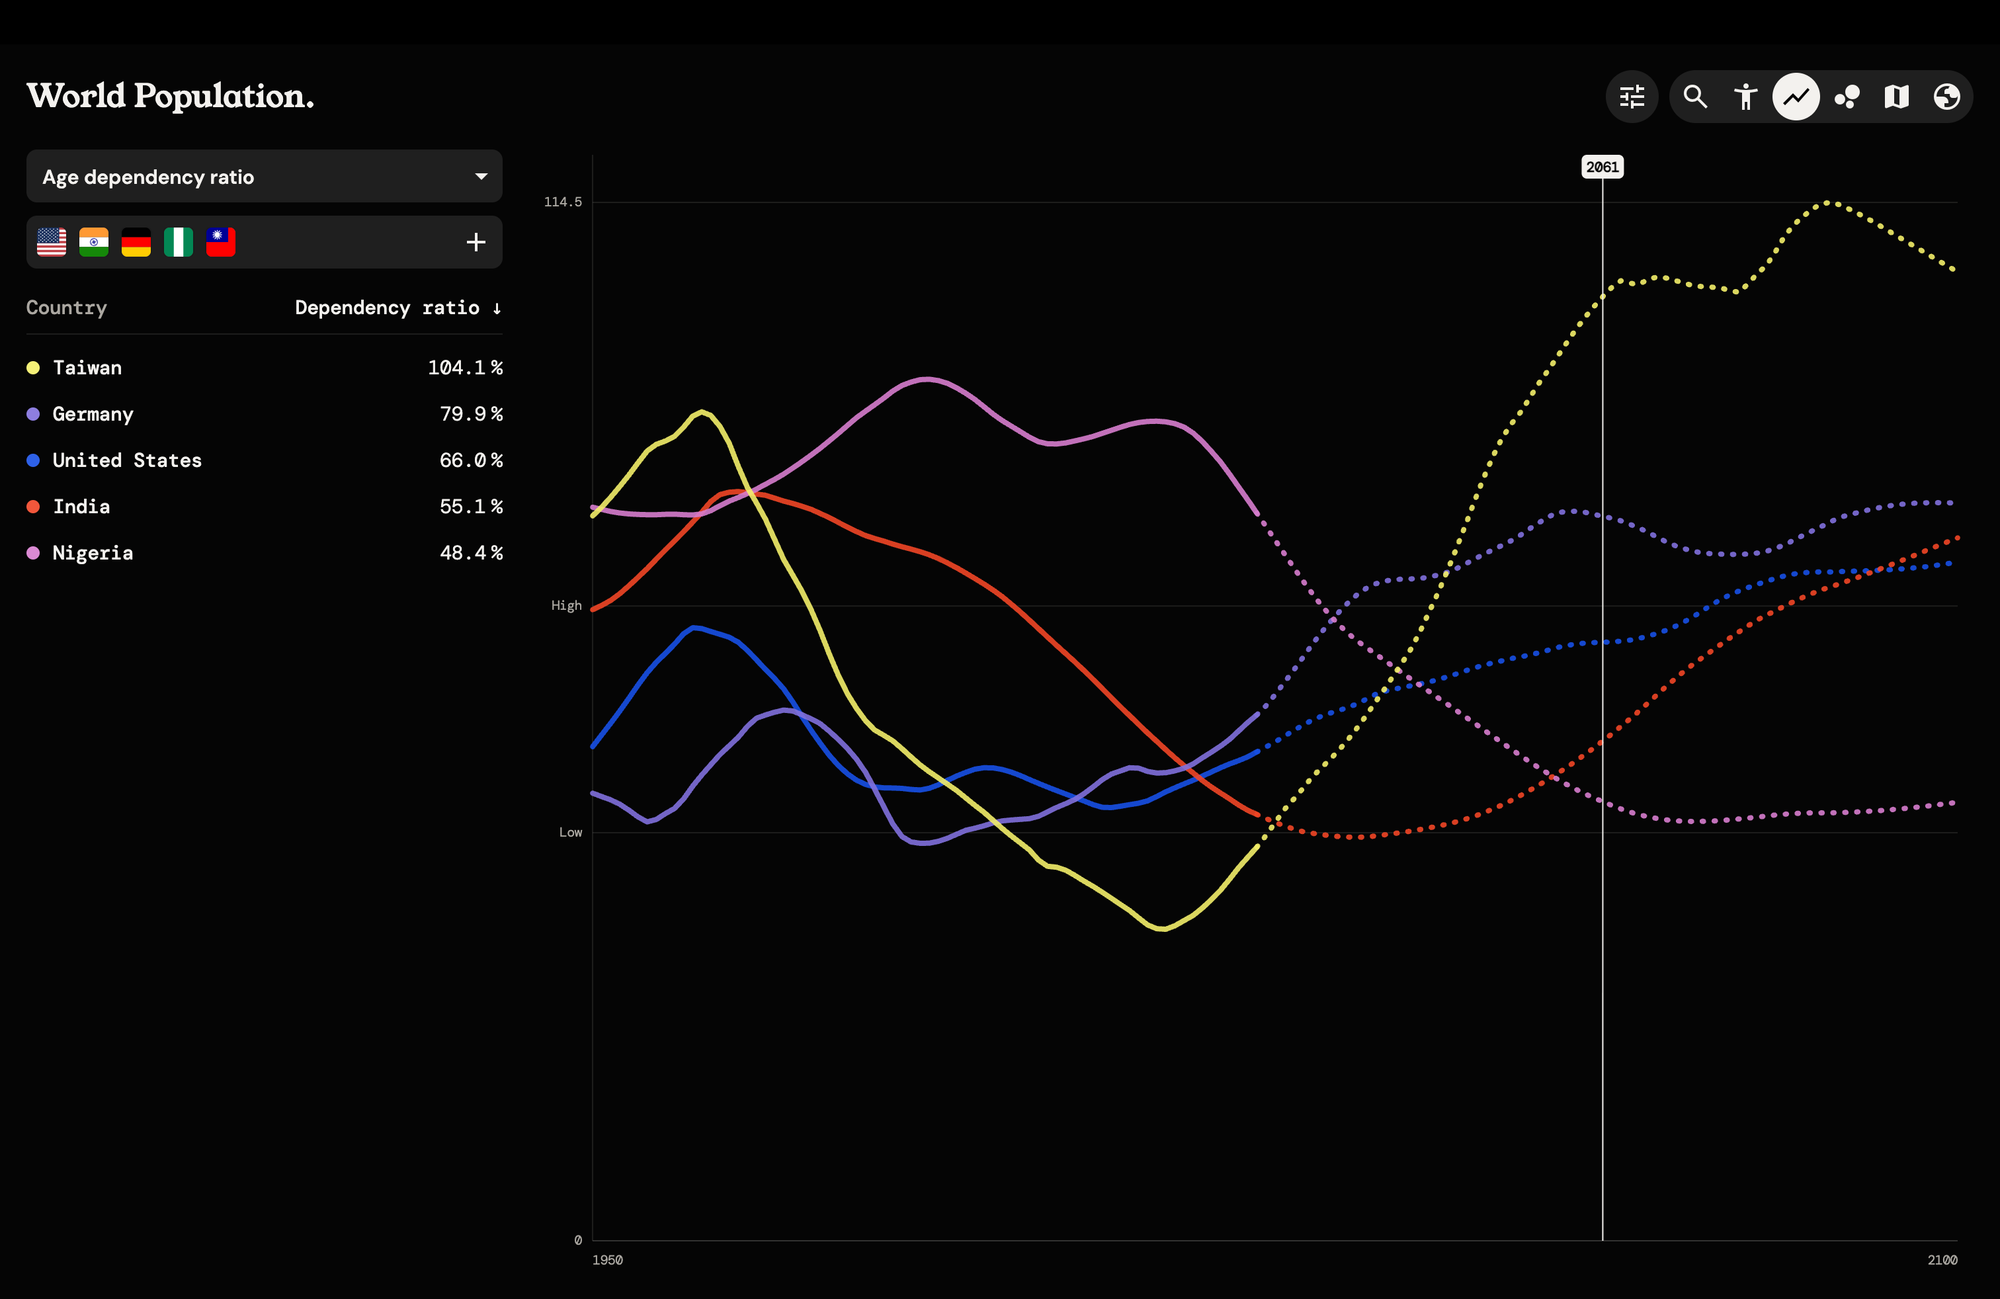
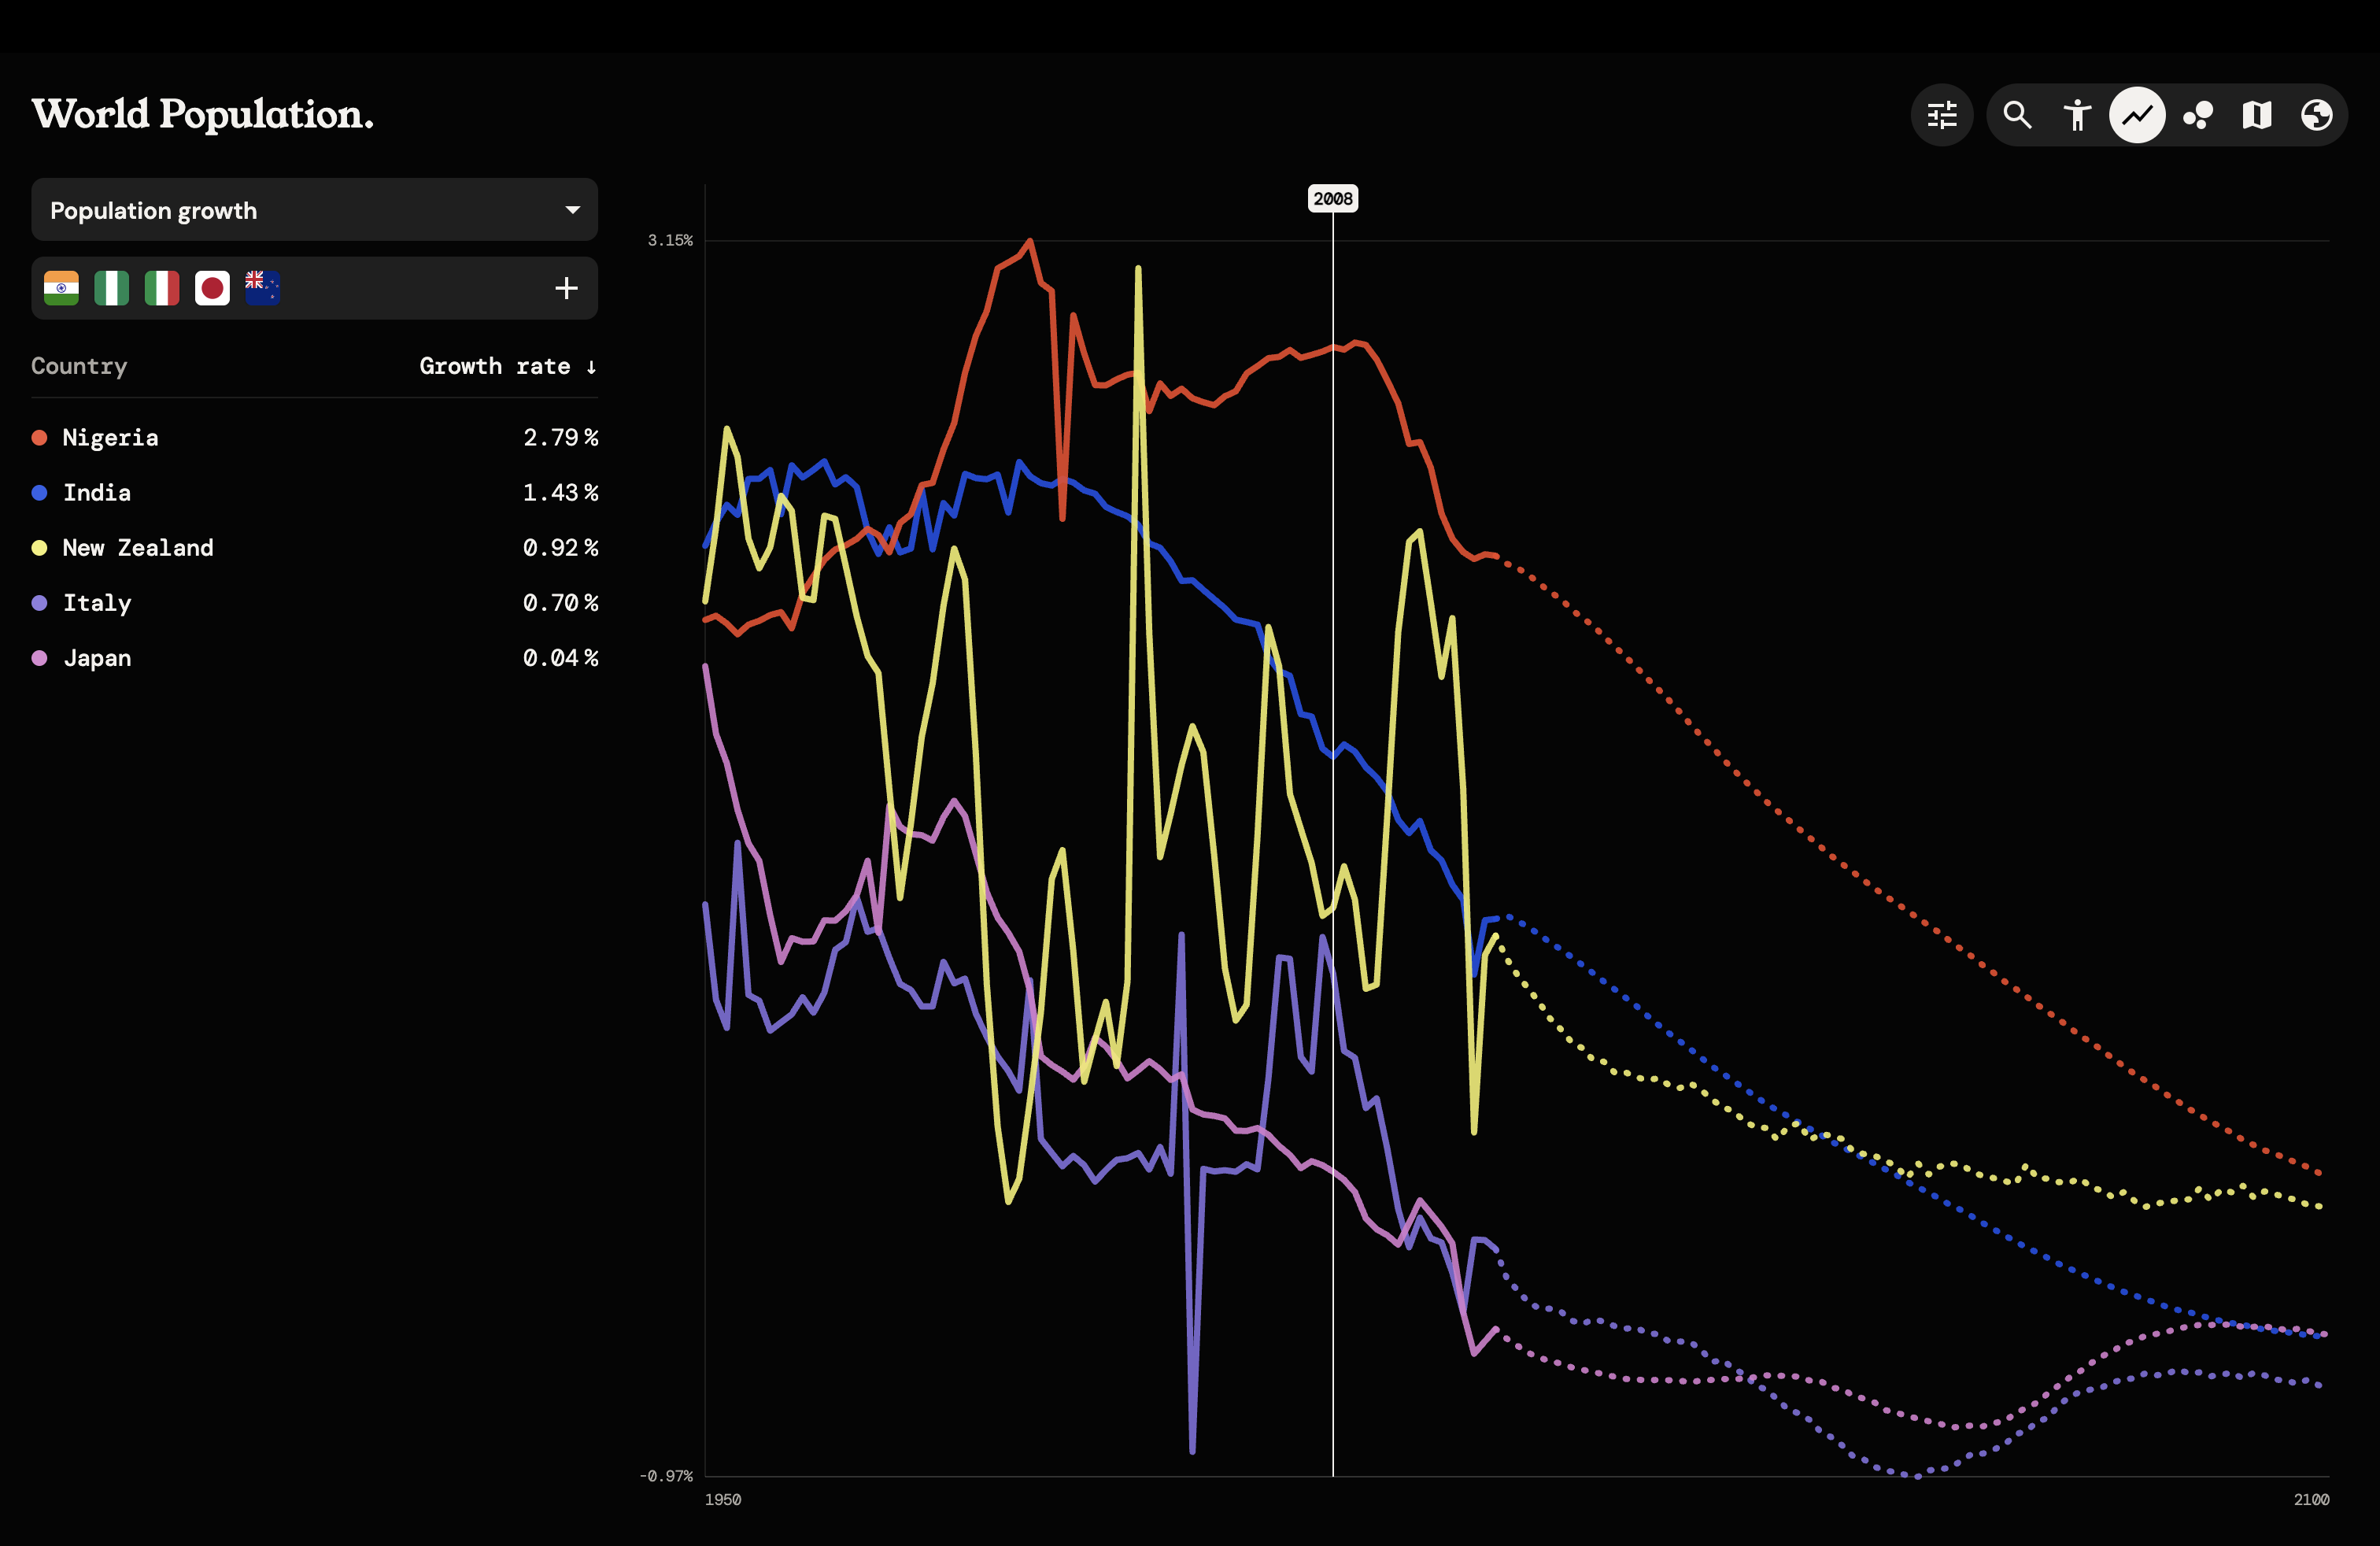
Chart View Pick any combination of countries and drop them onto a single trend line, tracking population, growth rate, fertility, life expectancy, age dependency ratio, or net migration side by side from 1950 through 2100.
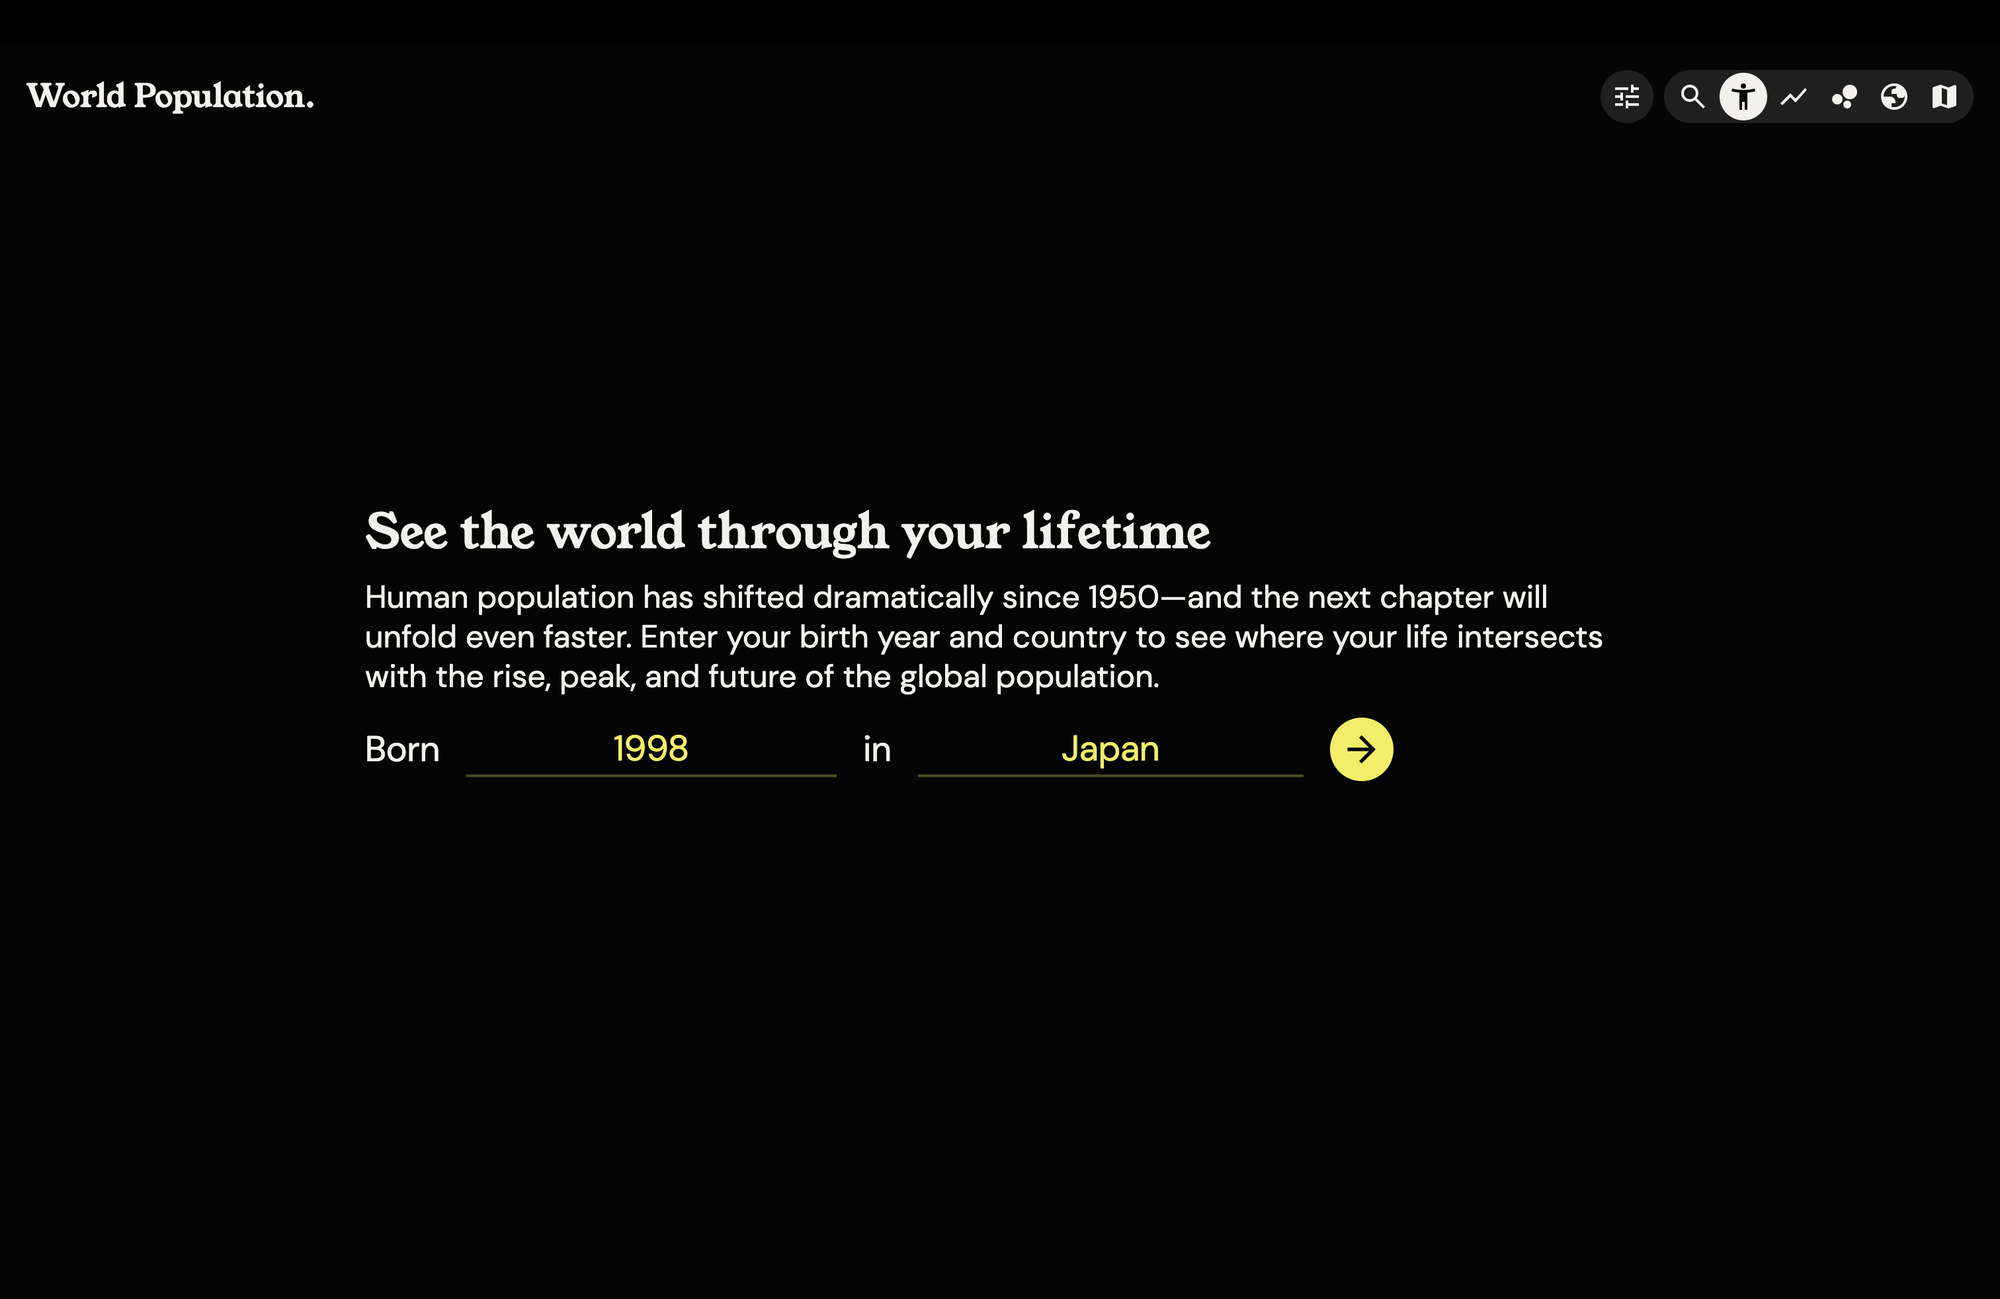
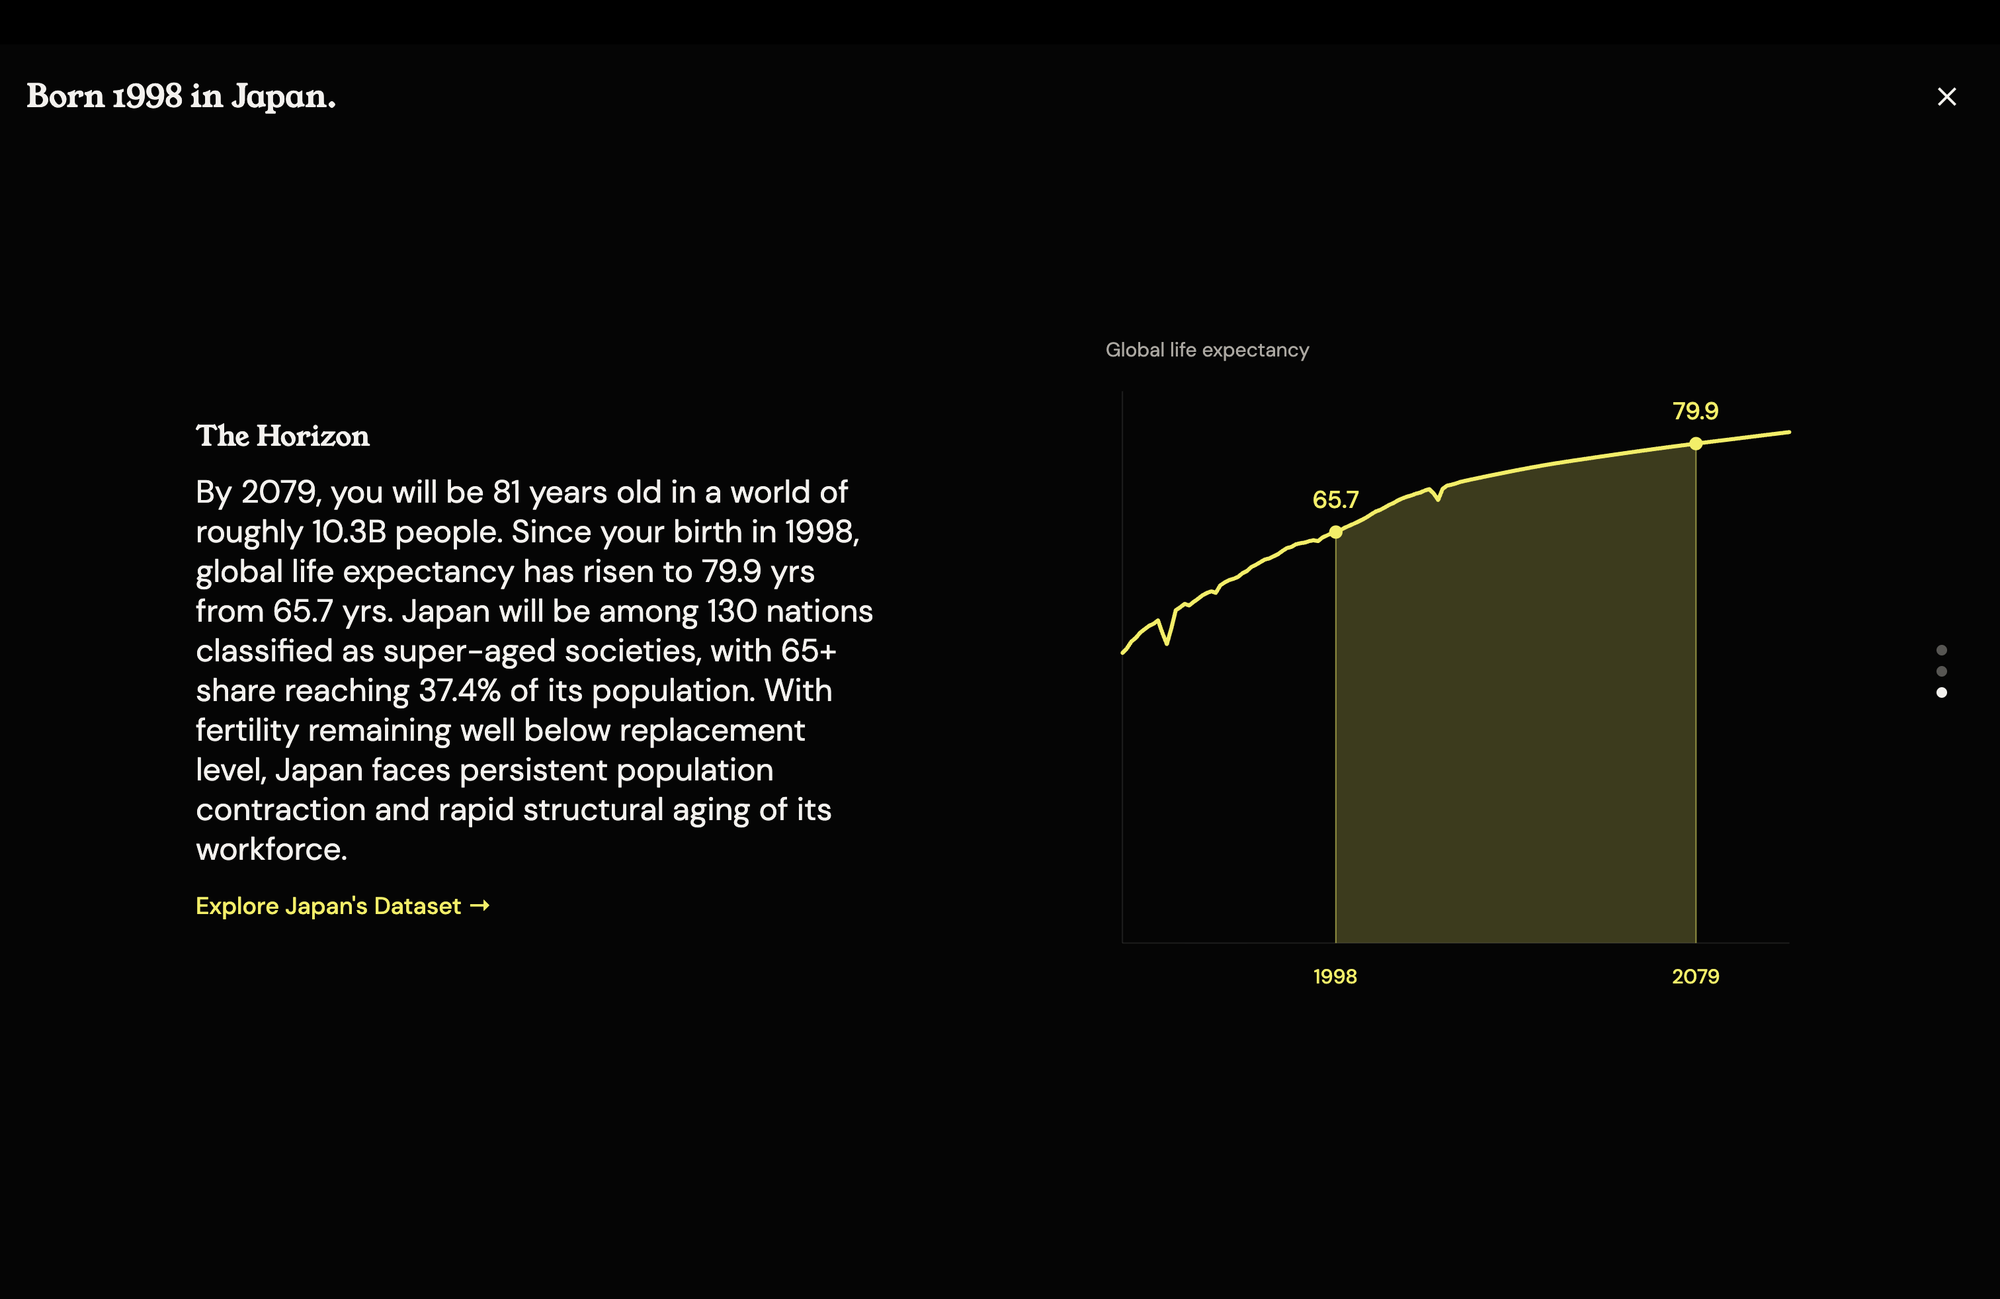
Your Lifetime provides a personalized lens on global demographic shifts by mapping world population data directly onto your life story. Simply enter your birth year and country to explore how humanity grows, ages, and evolves alongside you—from past milestones to future projections.
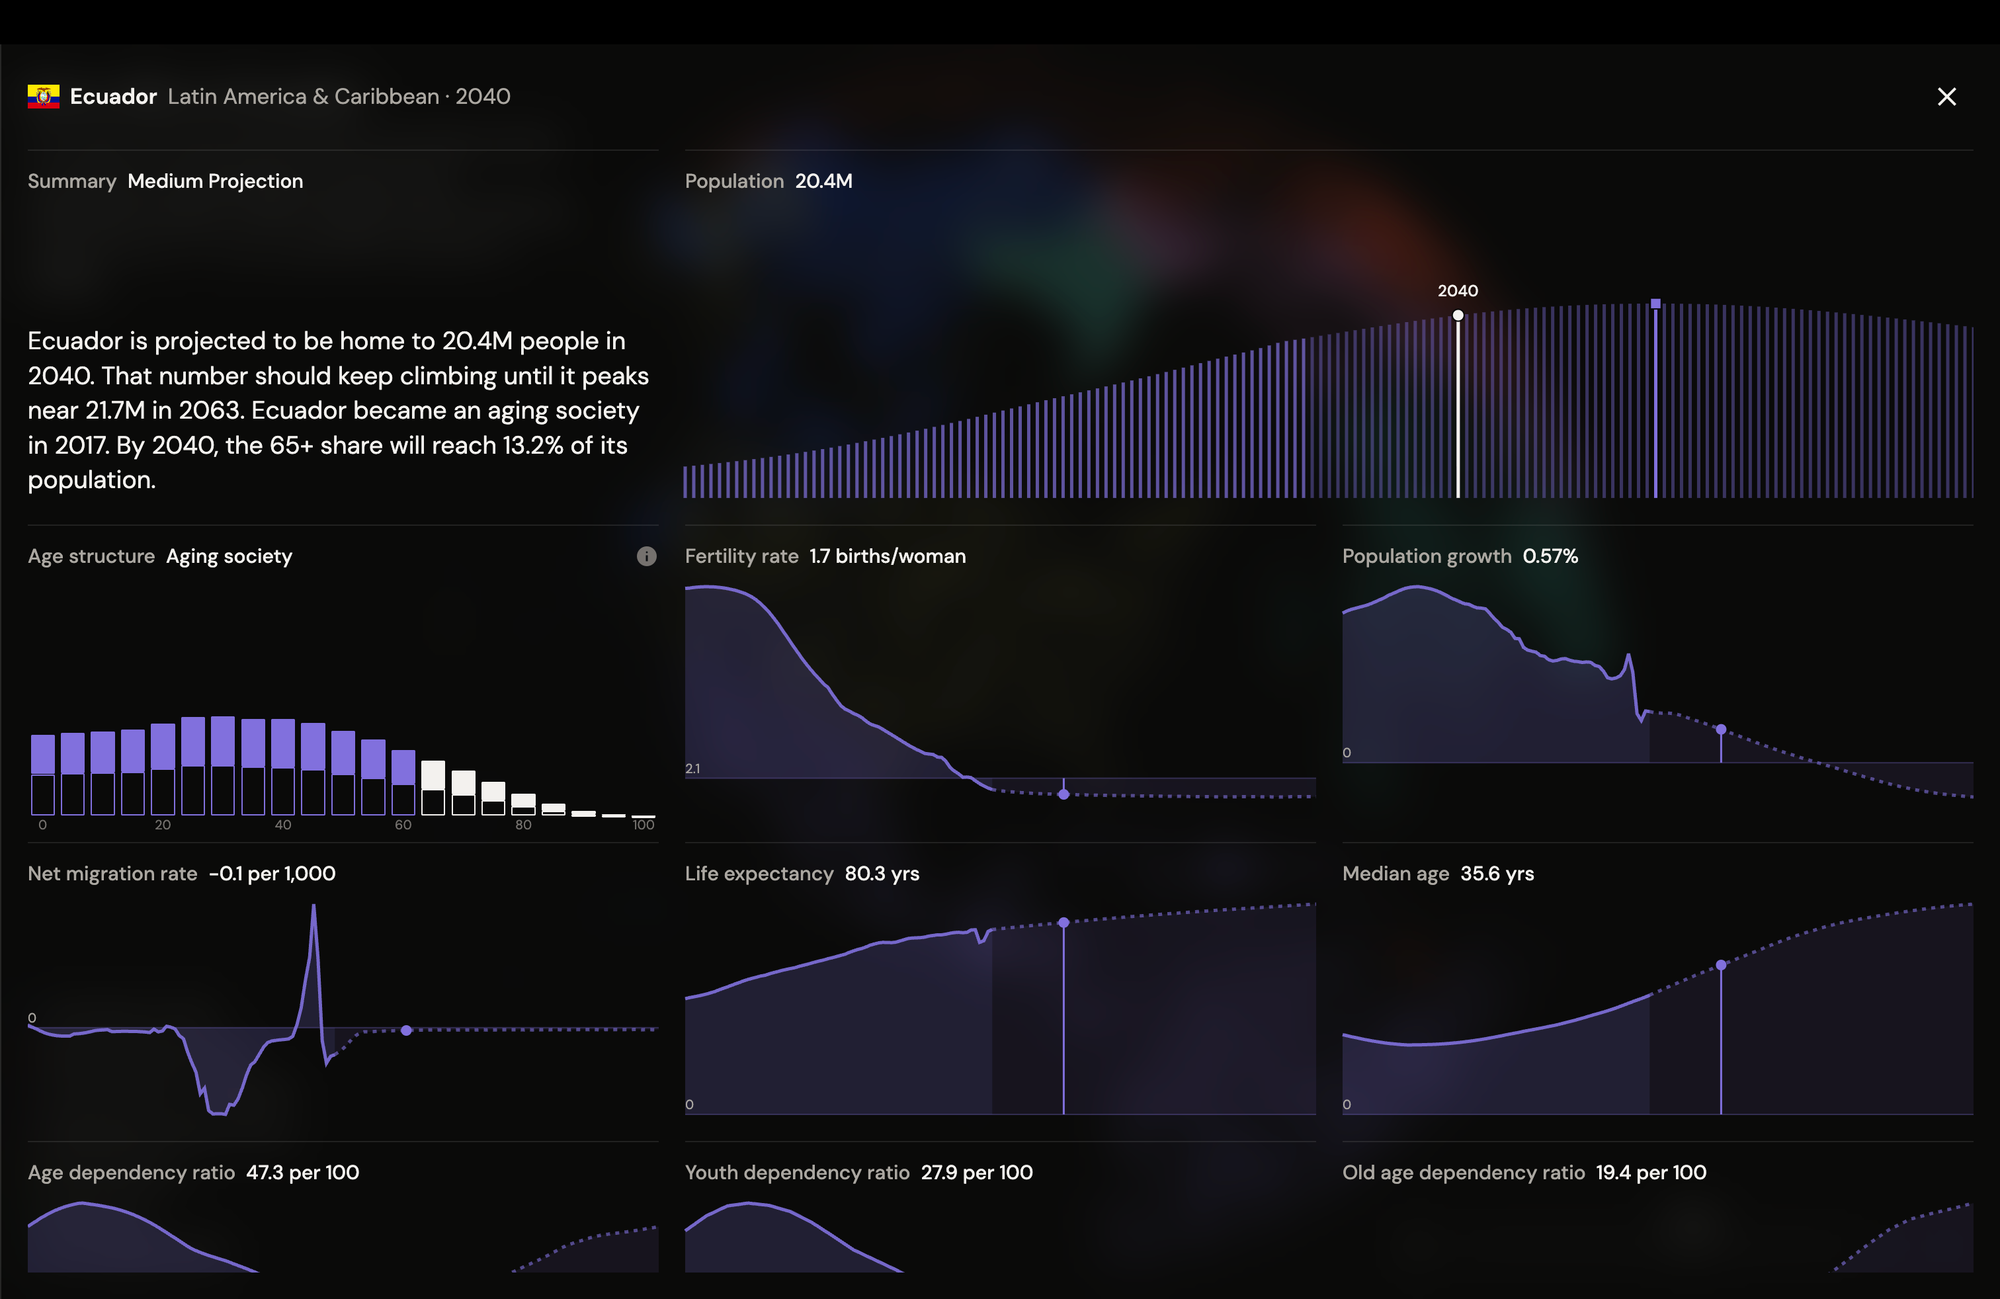
Country Overview Deep-dive into any nation’s demographic evolution. Drag the white marker to travel through time, uncovering key insights across growth, age structure, fertility, life expectancy, and migration in a single, focused view.
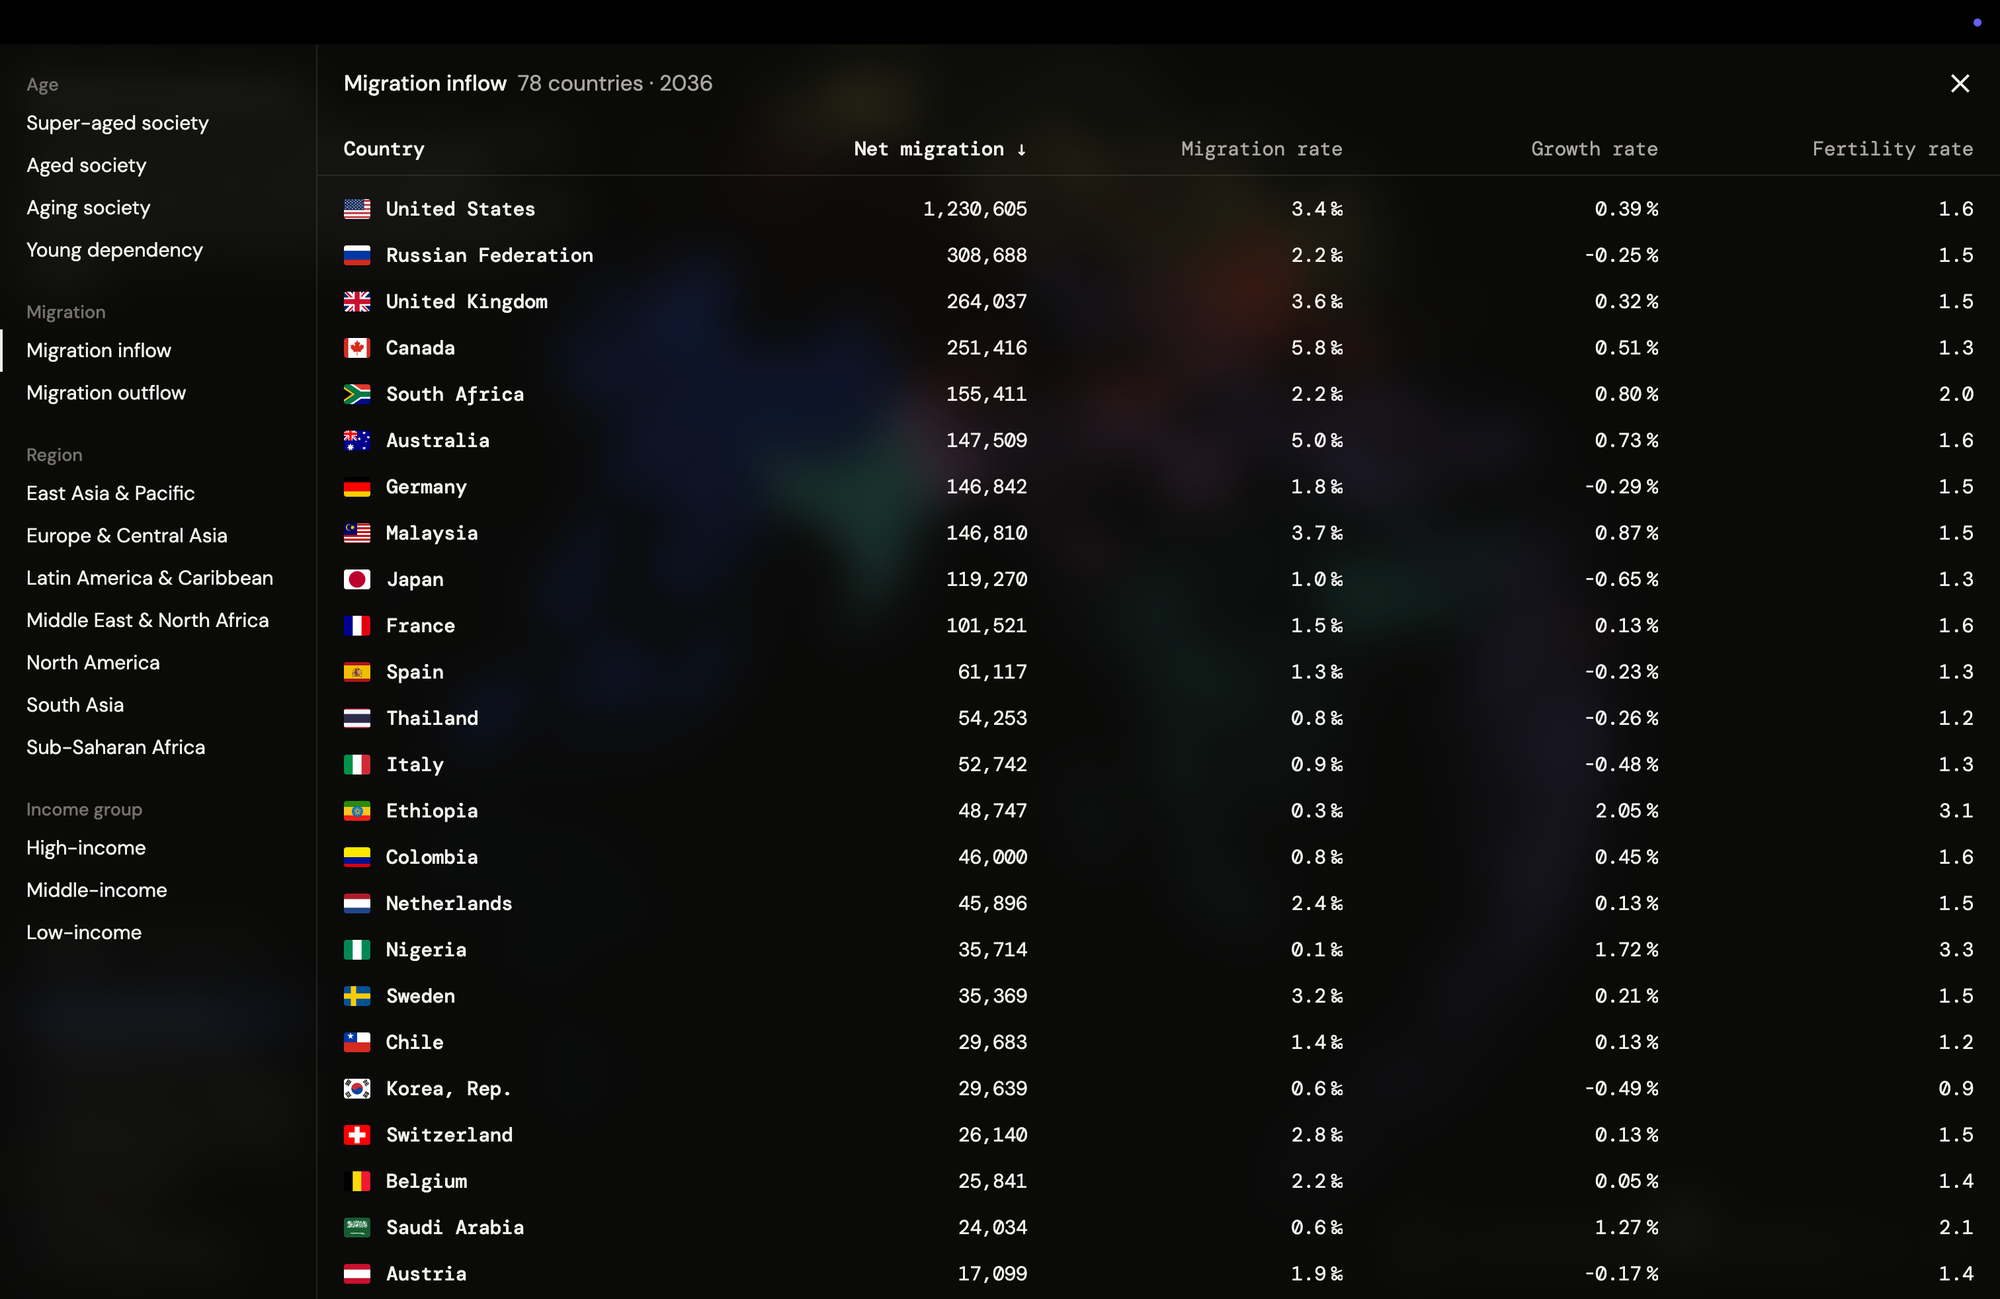
Demographics Explorer Browse and filter nations by demographic indicators—including age structure, migration flow, region, or income level. Selecting a category populates a dynamic, sortable table to quickly compare metrics across countries.